Analysis of the Four Heart Sounds Statistical Study and Spectro- Temporal Characteristics
* Debbal Sidi Mohammed El Amine;
-
* Debbal Sidi Mohammed El Amine: Department of Biomedical Engineering, Tlemcen University, Tlemcen, Algeria.
-
Jul 08, 2020 |
-
Volume: 1 |
-
Issue: 4 |
-
Views: 6205 |
-
Downloads: 1301
-
Download PDF
Abstract
The study of the functioning of the heart is significant for the diagnosis of different cardiac pathologies. The Phonocardiogram Signal (PCG) is the signal generated after converting the sound noises coming from the heart into an electrical signal, it groups together a set of four cardiac noises (S1, S2, S3 and S4) which are in direct correlation with cardiac activity. The Short-Term Fourier Transform (STFT) is an analytical technique that describes the evolution of the time and frequency behavior of these four heart sounds. A statistical study has been carried out in this direction in order to highlight the characteristics of the PCG signal better. A fairly high number of cycles (twenty) was used to refine the expected results further.
Introduction
The clinical application of vibroacoustic heart signals was extensively studied 30–40 years ago [1,2]. Analysis techniques, including time-domain, frequency domain, and modeling methods, have been developed for heart sounds [3]. However, with the introduction of modern imaging techniques, much of the recent research on physiological heart signal analysis has focused on electrical and ultrasonic signals, whereas mechanical and acoustic signals were relatively overlooked. Also, it turns out that phonocardiography gives a lot more results when studying the functioning of the heart valves (mitral, pulmonary, tricuspid, and mitral). During a transplant of a prosthesis replacing one of these four valves (responsible for heart sound), it is easier to proceed with the transplant by phonocardiography, which gives impressive results.
The processing of the Phonocardiogram Signal (PCG) in terms of recordings is essential for the diagnosis of various cardiac pathologies. The PCG signal confirms, and above all, refines the auscultation data and provides additional information on sound activities regarding the chronology of pathological signs in the cardiac cycle, by situating them in relation to normal non-pathological sounds of the heart [4–8].
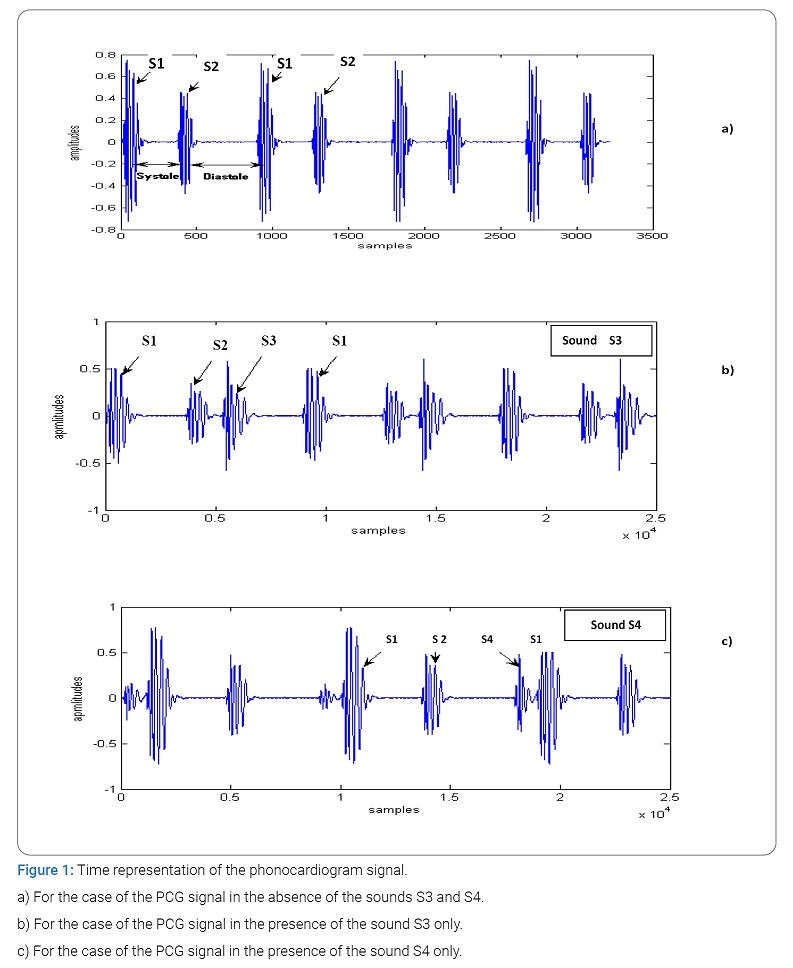
Under normal conditions, the heart produces four sounds during each cycle, but most often, only two essential sounds appear (S1 and S2), as shown in (Figure 1). The other two sounds (S3 and S4) have much smaller amplitudes than the first two so that they can only appear under very specific conditions (childhood or old age or as precursors of any pathology) [5].
The sound S1 corresponding to the start of the ventricular systole is due to the closure of the atrioventricular valves. This sound is made up of four internal components, two of which are the main: the mitral component M1 associated with the closure of the mitral valve and the tricuspid component (T1) associated with the closure of the tricuspid valve [9]. The sound B2, marking the end of the ventricular systole and signifying the start of the diastole, is composed of two main components: the aortic component (A2) corresponding to the closure of the aortic valve and the corresponding pulmonary component (P2) when the pulmonary valve closes [9].
The cardiac sounds S1 and S2 represented by (Figure 1) are by definition non-stationary signals (whose spectral properties, therefore, vary as a function of time) and are located in the low-frequency range, approximately between 10 Hz and 300 Hz [6]. The sound S2 a greater frequency range than that of the sound S1 [10].
The duration separating the two components A2 and P2 from the sound S2 is generally less than 30 minutes under normal conditions [11]. The study and measurement of this duration are important for cardiology specialists for the screening of certain cardiac diseases.
The standard Fourier transform (FFT) can be used for the analysis of the PCG signal, but it can only give information on the frequency content of the sounds of the cardiac signal studied. This method remains limited in the case of non-stationary signals, which is the case of the Phonocardiogram Signal (PCG). Above all, the FFT is unable to provide indications concerning the time course of the signal analyzed if the stationarity criterion is violated [12].
The phonocardiogram signal representing the time course of heart sounds is considered, like many other biomedical signals, to be a non-stationary signal. To effectively understand such signals, it is important to study their time-frequency characteristics.
The Short-Term Fourier Transform (STFT) as a time-frequency analysis method can be applied. This consists of sliding an analysis window along the signal studied, but the dimensions of this window must be fixed so as to guarantee the stationarity conditions [12]. S1 and S2 are the two main physiological sounds heard during auscultation of a normal heart. S1 corresponds to the tensioning of the walls of the left ventricle at the start of systole. S2 is a high-frequency sound. Between S1 and S2 is the systole, and between S2 and S1 is the diastole (Figure 1a). Generally, the sounds S3 and S4 do not appear on the phonocardiography plot for a healthy subject (Figure 1b, Figure 1c).
The first heart sound (1): It registers in low-frequency 10 Hz to 200 Hz last 100 minutes its recording focus is located at the tip of the heart, the phonocardiographic analysis makes it possible to distinguish four components among which only the second and the third are audible.
This sound is contemporaneous with the closing of the Atrioventricular (AV) valves, the contraction of the ventricles, and the opening of the sigmoid valves. It seems that the two audible components of these sounds are linked to the mobilization of the AV valves. Phono-cardiographic recordings, it is thus possible to discern two contemporary components M1 and M2 of the closings of the mitral and tricuspid valves.
The second heart sound (S2): This sound marking the end of the ventricular systole lasts less than 100 minutes and is located in high-frequency 20 Hz to 250 Hz. Its recording focus is located at the base, that is to say at the upper part of the thorax, on either side of the sternum; Most often, this second sound consists of four components, two of which are main. The first aortic (A2) and the second pulmonary (P2). This second sound (S2) is contemporaneous with the closing of the sigmoid valves.
The third heart sound (S3): The third sound S3 from the heart occurs at the start of diastole 0.1 seconds to 0.2 seconds after the second sound, at the end of the rapid ventricular filling phase: it is usually of low-frequency 25 Hz at 75 Hz and can be heard normally in children or adults under 30 years of age. Beyond this age, its presence most often testifies to a pathological state, “protodiastolic gallop” of heart failure.
The fourth heart sound (S4): This fourth sound S4, which is never audible under normal conditions, manifests itself on the plot by small, low-frequency oscillations from 15 Hz to 75 Hz. It is due to the arrival of the systolic atrial wave in the ventricular cavity, B4 Sound is generally of lower frequency than B3 sound and shorter duration.
Short-Term Fourier Processing Technique
The Fourier transform: This analysis is a frequency type analysis, extended to regimes which are not necessarily sinusoidal. Fourier analysis is widely used in electricity as in physics. The terms of the Fourier series are sinusoidal and cosine functions. Again, we can see the importance of the harmonic analysis of systems, since the relevance of these decompositions is guaranteed for any linear system (principle of superposition) [13]. The Fourier transformation has already been pointed out as a particular mathematical case of the Laplace transformation. It is widely used in all technical branches with vast and diverse implications: from relationships of uncertainty in physics to reciprocal spaces in crystallography, of course, via electricity. The Fourier transformation can be seen mathematically as a special case of that of Laplace, by posing  for the frequency variable. We define:
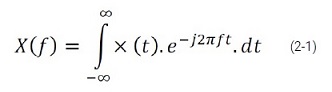
Despite its immense success, this technique has several shortcomings [10–11], in particular, its obvious lack of temporal localization. FT is a reversible transformation; that is to say, it allows “round trips” between the raw signal and the processed (transformed) signal. However, only one of them is available at any given time. No frequency information is available in the time domain and no time information is available in the signal FFT [14–20].
Indeed, the Fourier analysis makes it possible to know the different frequencies excited in a signal, that is to say, its spectrum, but does not make it possible to know at what instants these frequencies were emitted. This analysis gives global and not local information because the analysis functions used are sinusoids, which oscillate indefinitely without damping. This loss of locality is not a drawback for analyzing signals whose structure changes little or not (statistically stationary) but becomes a problem for the study of non-stationary signals. The Fourier analysis does not allow the study of signals whose frequency varies over time. Such signals require the establishment of a time-frequency analysis, which will allow localization of the periodicities over time and will, therefore, indicate whether the period varies continuously if it disappears then reappears thereafter, etc.
Thus, the definition of the Fourier transformation is the source of a major drawback. Indeed, the result obtained by this transformation is either a function of time or a function of frequency, which prohibits any access to a concept such as instantaneous frequency. If one wishes to study a non-stationary signal and detect the frequency variations by associating them at a given instant, the Fourier transformation is without interest. To meet this new requirement, time-frequency analysis tools are used.
A non-stationary signal is defined as opposed to a stationary signal for which all of its statistical properties are invariant over time. In the deterministic context, a signal whose frequency content changes over time are called a non-stationary signal. It suffices that a single statistical property or a single frequency component is variable over time so that one can speak of a non-stationary signal. If, for example, in a signal, there is a frequency drift overtime or a time average jump, then it is a non-stationary signal.
The Short-Term Fourier Transform (STFT): The Short-Term Fourier Transform (STFT) and its derivatives (notably the spectrogram) are the time-frequency methods most used in practical applications if the signals to be analyzed are non-stationary. Thus, this class of methods represents the most widespread solution to eliminate the limitations of the Fourier transform. The basic idea is very simple and effective: the signal is broken down into small segments, and the Fourier transform is applied to each of the segments, thus obtaining the “local” spectrum. The totality of the “local” spectra then indicates how the spectrum varies over time. The signal is broken down by means of a window (“h”) where the index τ represents the time positioning of this window, and therefore the positioning of the spectrum corresponds.
The following formula summarizes the principle:


Corresponds to the spectrum of the signal S around τ. F is the frequency parameter.
The spectrum series thus formed represents a form of time-frequency transform of the signal called a spectrogram.
This processing makes the assumption of stationarity during the duration of the window h whatever the part of the signal considered. The length of the window is, however, chosen to respect this assumption. This choice directly influences the resolution properties of the composition; the smaller the window h, the better the temporal resolution, but the worse the frequency resolution. If a high-frequency resolution is necessary, then a long time window h will be used, and it will not be easy to respect the stationarity hypotheses. The shape, the length of this window as well as the increment step are parameters set before the analysis. They presuppose a good a priori knowledge of the signal to be analyzed [15–20].
If we want good time localization, we need a narrow window h (t), and if we want good frequency localization, the window H (f) must be narrow. However, as narrow h (t) leads to a wide H (f) and vice versa, we will always have a compromise to solve when it comes to choosing the window h (t). This choice is limited by Heisenberg’s inequality:
Δt x Δf ≥ 1/2 (2-3)
Results and Discussion
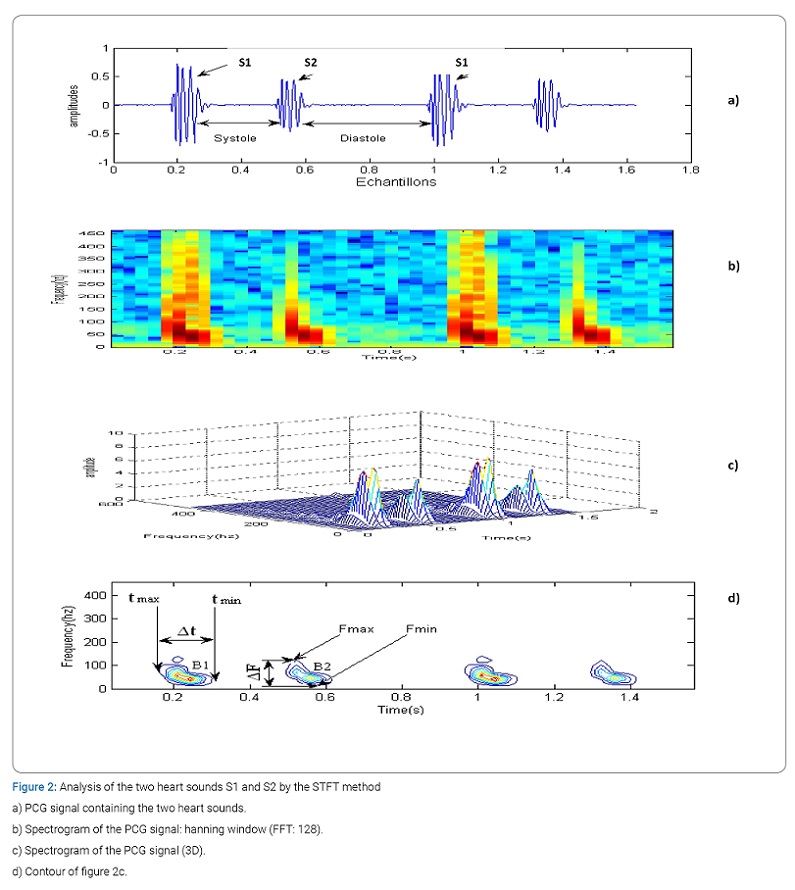
In this section, we will apply the Short-Term Fourier Transform (STFT) on the normal PCG signal in order to note the time-frequency characteristics of the four cardiac sounds (Figure 2). The STFT is a technique widely used for the time-frequency representation of non-stationary signals, as is the case here of the PCG signal.
This technique consists in calculating the Fourier transform of the product between the signal to be analyzed and a suitably chosen window. In this case, we chose the Hanning window (FFT: 128) in order to obtain a better spectro-temporal resolution. The translation of this window along the PCG signal is equal to half of its duration in order to recover the samples which are located at the start and at the end of the segments considered.
The interest of the spectrogram is to be able to represent the spectrum as a function of time. This spectrum is then represented in the form of color code (Figure 2b), where yellow corresponds to the strongest amplitudes, blue/purple, to the weakest amplitudes. This gives a better representation of the shape of the spectrum as a function of time.
The calculation of the power spectral density of a set of elementary segments of the PCG signal gives a three-dimensional “3D” representation (amplitude, time, frequency), as illustrated in (Figure 3c). The values of the duration of the temporal extent (Δt) and of the frequency extent (ΔF) can be deduced from the graphic representation of (Figure 3d), which corresponds to a projection of contours of (Figure 3). The measurements of Δt and ΔF will be carried out over several cycles (20) which brings us to carry out a statistical study of the measurements obtained for the choice of Δt and ΔF (respective mean value of the temporal and frequency range) and the rate of their variation (standard deviation).
With: tmax: maximum value of the extency temporal, tmin: minimum value of the extency temporal:
Δt: temporal extency (Δt = tmax–tmin) and
Fmax: maximum value of the frequency extency, Fmin: minimum value of the frequency extency.
ΔF: frequency extency (ΔF = Fmax–Fmin).
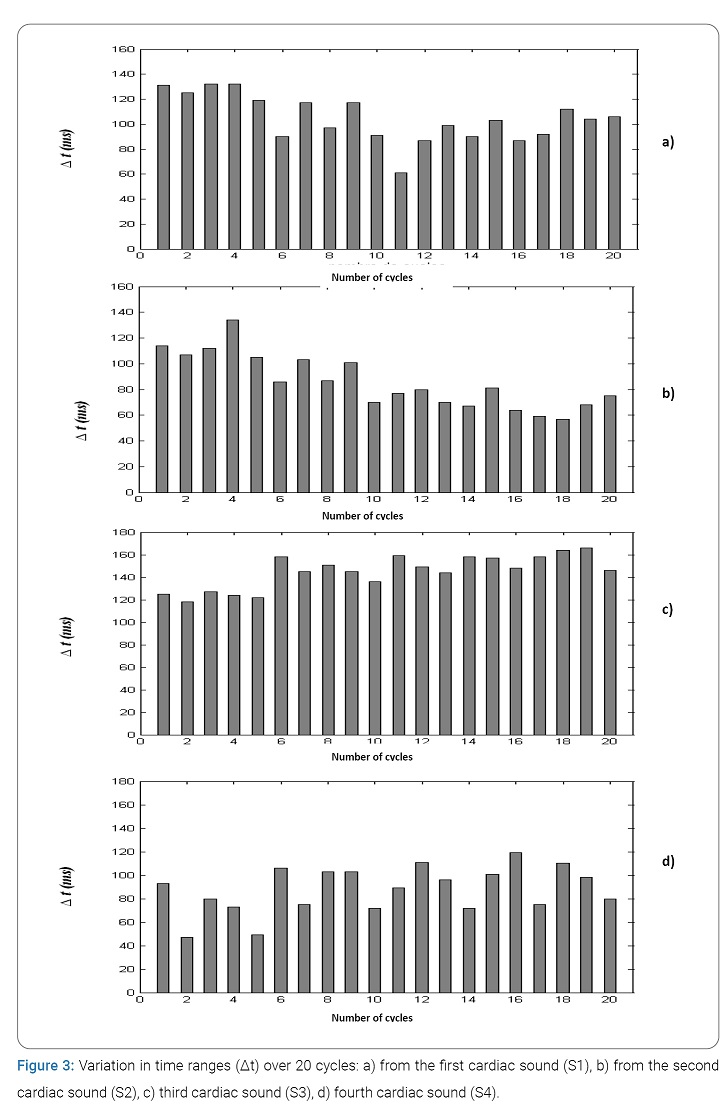
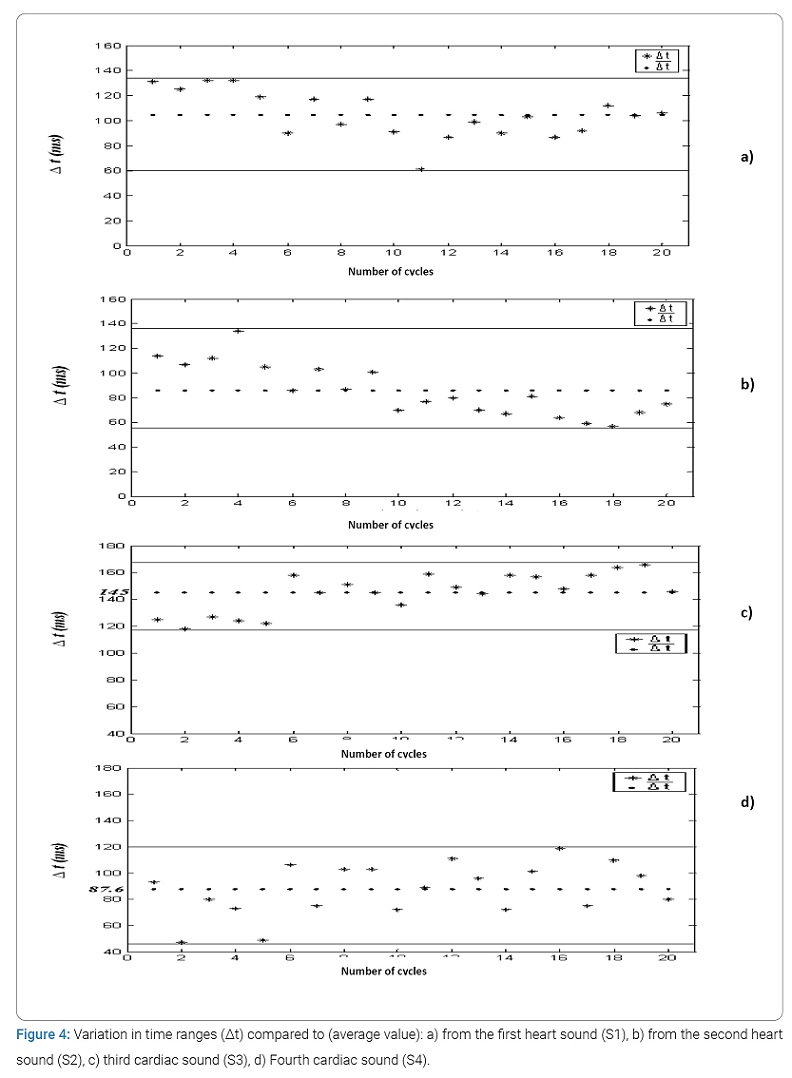
Temporal study of the four cardiac sounds: (Figure 3) represents, respectively, the variation (in the form of histograms) of the temporal duration of the cardiac sounds S1 and S2 of a normal PCG signal. Note that this duration is varying between 60 minutes and 130 minutes for S1 and S2, respectively. From the curves in (Figure 4) concerning the plot of the variation of the temporal extent compared to the average value of the two heart sounds S1 and S2 (respectively 104.6 minutes and 85.85 minutes) as a function of the number of cycles, it seems very It is obvious that the area of variation is very similar which was to be expected since the values of the standard deviations for these two cases are not very far apart (18.59 minutes for S1 and 21.26 minutes for S2). We can, on the other hand, note that the dispersion of the values of Δt is greater upwards than downwards for S1 and vice versa for S2.
(Figure 3) also shows the evolution of the variation in the temporal duration of the heart sounds of a normal PCG signal. We note that this duration between 118 minutes and 166 minutes for cardiac sound S3, (with an average value of 145 minutes) and between 47 minutes and 119 minutes for cardiac noise B4 (with an average value of 87.6 minutes). From the curves of (Figure 4) concerning the plot of the temporal variation compared to the average value of the two heart sounds S3 and S4 as a function of the number of cycles, it seems obvious that the zone of variation of S3 is smaller than that concerning noise S4. This is comforted by the value of standard deviations 14.89 minutes and 19.87 minutes, respectively, for S4. The sound S3 is thus more stable than the sound S4.
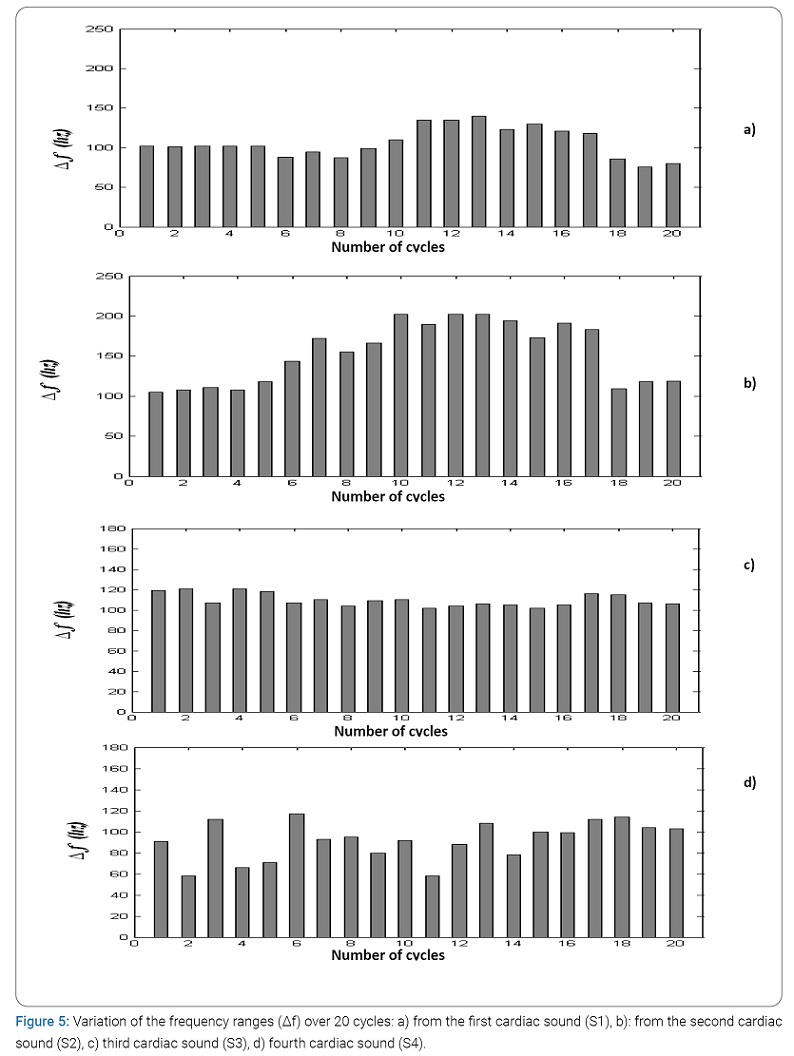
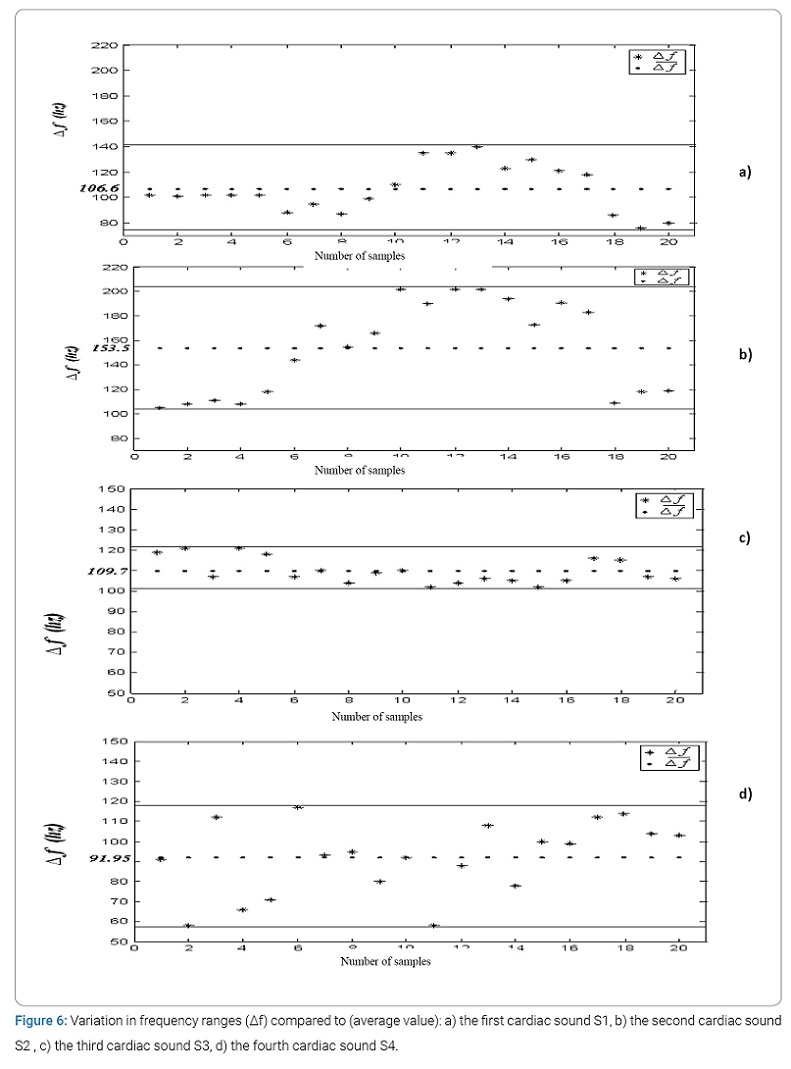
Frequency study of the four heart sounds: The variation in the frequency range of cardiac sounds S1 and S2 (in the form of histograms) illustrated by (Figure 5) of normal PCG signals, varies between 76 Hz and 140 Hz for cardiac sound S1 (with an average value of 106.6 Hz) and between 102 Hz and 202 Hz for cardiac sound S2 (with an average value of 153.5 Hz). From the curves of (Figure 6) concerning the plot of the variation of the ranges compared to the mean value of the two heart sounds S1 and S2 as a function of the number of cycles, it seems that the area of variation of the frequency ranges around its mean value of sound S2 is much greater than that of Sound S1. The fluctuations of S2 are therefore greater than that of S1. The values of the standard deviations confirm these results (37.88 for S2 and 19.19 for S1).
(Figure 5) also shows the variation in the frequency range of cardiac sounds S3 and S4 of a normal PCG signal over the 20 cycles concerned. Note that this range is between 102 Hz and 121 Hz for cardiac sound S3, (with an average value of 109.7 Hz minutes) and between 66 Hz and 117 Hz for cardiac sound S4 (with an average value of 91.95 Hz).
From the curves of (Figure 6) concerning the plot of the temporal variation compared to the average value of the two cardiac Sound S3 and S4 as a function of the number of cycles, it seems obvious that the zone of variation of S3 is smaller than that concerning sound S4. The values of the standard deviations confirm these results (18.26 for S4 and 06.30 for S3).
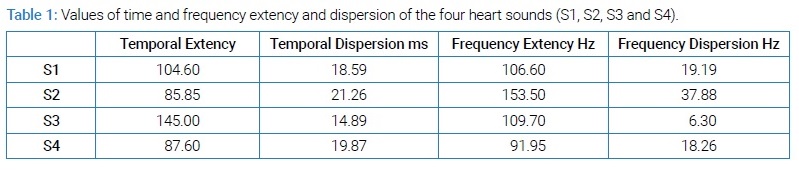
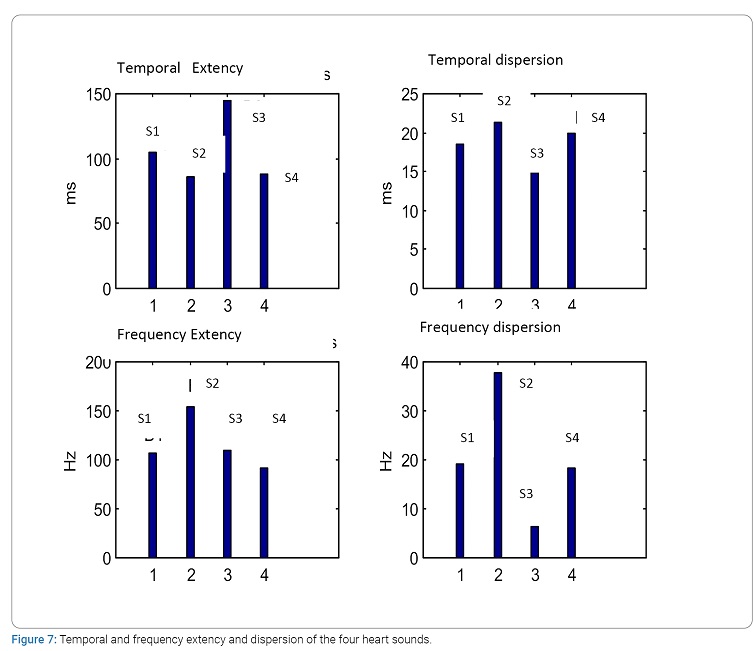
Synthesis: The spectro-temporal analysis of the PCG signal by the Short-Term Fourier Transform (STFT) has given us results obtained by the use of our method in accordance with practical bibliographic data [10]. (Table 1) summarizes the main results of the time and frequency characteristics of heart sounds S3 and S4. (Figure 7) represents these same results obtained by histograms better reflecting the difference between the time and frequency ranges of the heart sounds studied.
Thus it is very clear that in the absence of sounds S3 and S4 (normal PCG signal case):
- The duration of sound B1 is greater than that of sound S2.
- The frequency range of sound S2 is greater than that of sound S1.
In the presence of sounds S3 and S4:
- The least important duration is that of sound S3 and the most important frequency range is that of sound S2.
- The variation stability (time and frequency) concerns the sound S3 e much more than the other three sound.
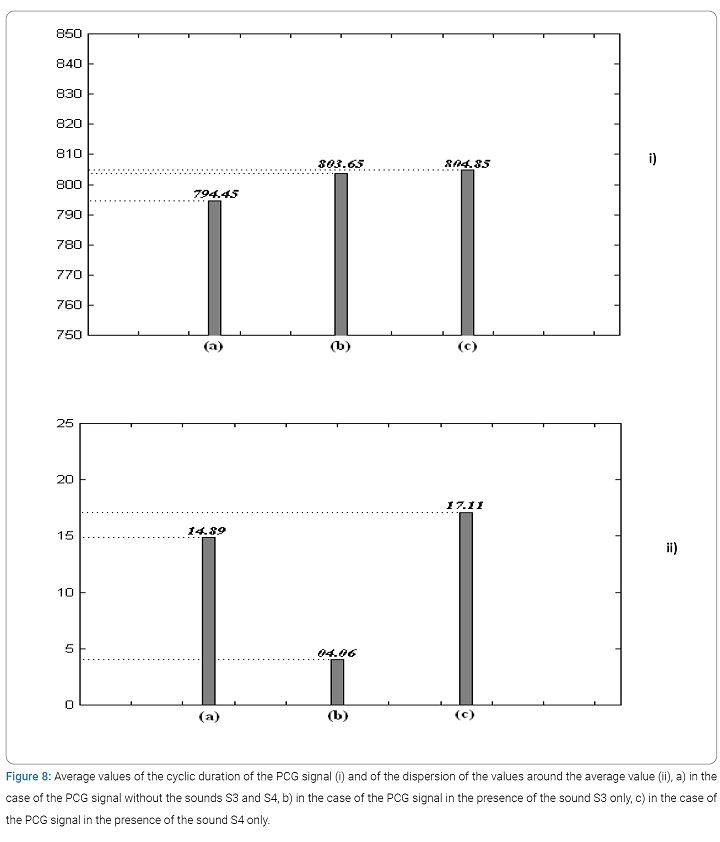
Study of the variation of the cardiac cyclic duration of the PCG signal in the presence of cardiac sounds [21]: By considering (Figure 8), which represents the average variation of the cardiac cycle (function of the number of cycles) we notice well that for the cardiac sound S3 the average value is smaller than that concerned by the sound S4 but for the two cases (S3 and S4) the value of the cyclic duration is greater than in the case of a normal PCG signal, i.e. a PCG signal comprising only the two main sounds (S1 and S2). (Figure 8 ii) representing the average dispersion of the measured values of the cardiac cycle clearly shows that it is for sound S4 that the variations are greater.
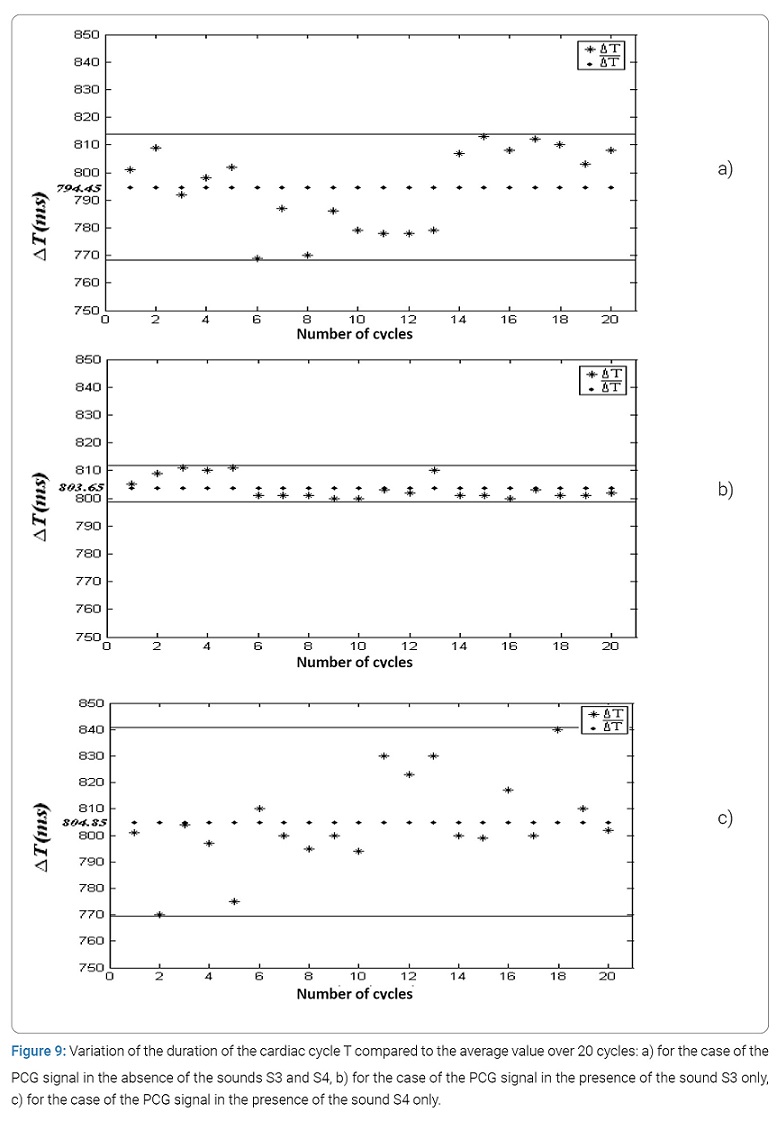
The curves of (Figure 9) concerning the plot of the variation of the cardiac cycle compared to the average value reinforces the results found and represented by (Figure 8). It thus seems that the cardiac cycle has a much more stable variation for the PCG signals comprising the sound S3 than for the PCG signals comprising the sound S4.
Conclusion
The application of the Short-Term Fourier Transform (STFT) in the analysis of the four cardiac sounds S1, S2, S3 and S4 made it possible to obtain very important information on the spectro-temporal characteristics of these sounds. The statistical study on the variation of these two parameters (duration, frequency) for each of the four sounds made it possible to consolidate the localization of the temporal and frequency values obtained. The results obtained show that the fluctuations of the time ranges are less significant than that of the frequency ranges in the analysis of a normal PCG signal.
In the presence of the sounds S3 and S4 or B4, it appears that it is sound S4 which influences much more than the sound S3 on the variation of this temporal and frequency extent although for both cases (S3 and S4) the values of the extent are smaller than those of a normal PCG signal. Concerning the variation of the cardiac cycle, it has been shown that the smallest variation (therefore more stability) is imposed by the sound S3. All of these results obtained can be further improved and consolidated if this statistical study can be carried out on a larger number of samples (at least 100 cycles). The results obtained can thus be used for a better understanding of cardiac acoustic activity.
The various statistical parameters obtained in this paper can be used effectively by the cardiologist clinician to help him establish his medical diagnosis.
By means of the values of the statistical parameters established, it is, therefore, possible to make a pathological distinction and also to decide on the pathological severity of the case analyzed.
Conflict of Interest
The authors claim no conflicts of interest.
References
- Ramos JP, de Carvalho P, Paiva RP, Vale LD. Intelligent Phonocardiogram Analysis and Representation Tool. 2018.
- HEALTHINF 2011 - Proceedings of the International Conference on Health Informatics; Rome, Italy, January 26– 29,2011.
- État de l’art sur les stéthoscopes électroniques. 2015 ed; John Libbey; 21(4); Juillet-Août. 2015.
- Semmlow JL. Improved Heart Sound Detection and Signal-to-Noise Estimation Using a Low-Mass Sensor. IEEE Transactions on Biomedical Engineering. 2016;63(3):647– 652.
- Anumukonda M, Ramasahayam S, Prasada Raju LVR, Chowdhury SR. Detection of cardio auscultation using mems microphone. 9th International Conference on Sensing Technology (ICST) 2015, Auckland, New Zealand. 2015;173–177.
- Elamaran V, Arunkumar N, Hussein AF, Solarte M, Ramirez- Gonzalez G, editors. Spectral fault recovery analysis revisited with normal and abnormal heart sound signals; IEEE Access. 2018;6:62874–62879.
- Dwivedi AK, Imtiaz SA, Rodriguez-Villegas E. Algorithms for Automatic Analysis and Classification of Heart Sounds - A Systematic Review. IEEE Access. 2019;7:8316–8345.
- Demonstrations: Heart Sounds & Murmurs, Oct. 2016, [online] Available: https://depts.washington.edu/physdx/heart/demo.html
- Roy JK, Roy TS. A simple technique for heart sound detection and real time analysis, in Proceedings of ICST 2017, 2017 Eleventh International Conference on Sensing Technology (ICST) held at Marquette University Sydney, Australia. Dec 4–6, 2017.
- Obaidat MS. Phonocardiogram signal analysis: techniques and performance comparison. Journal of Medical Engineering technologie. 1993;17(6):221–227.
- Leung TS, White PR, Cook J, Collis WB, Brown E, Salmon AP. Analysis of the second heart sound for diagnosis of paediatric heart disease. IEE Proc-Sci Meas Technol 1998;145:285–290.
- Landrin Patrick Flandrin. Temps-fréquence, Edition Hes, collection traitement du signal, 1998.
- Boashash B, Time-frequency signal analysis, in Advances in Spectrum Estimation (S. Haykin, ed.), Englewood Cliffs, New Jersey: Prentice Hall, 1990.
- Taebi A, Mansy HA. Time-frequency Analysis of Vibrocardiographic Signals. 2015 BMES Annual Meeting, at Tampa, FL, USA.
- Zhang W, Han J, Deng S. Heart sound classification based on scaled spectrogram and partial least squares regression. Biomed Signal Process Control. 2017;32:20–28.
- Quiceno-Manrique AF, Godino-Llorente JI, Blanco-Velasco M, Castellanos-Dominguez G. Selection of dynamic features based on time-frequency representations for heart murmur detection from phonocardiographic signals. Ann Biomed Eng. 2010;38(1):118–137.
- Ghassemian H, Kenari AR. Early detection of pediatric heart disease by automated spectral analysis of phonocardiogram in children. Journal of Information System and Telecommunication (JIST). 2015;3(2):66–74.
- Debbal SM, Bereksi-Reguig F. Complementary analysis to heart sounds while using the short time Fourier analysis and the continuous wavelet transforms. Biomedical Engineering: Applications, Basis and Communications. 2007;19(5):331– 339.
- Debbal SM, Bereksi-Reguig F. Frequency analysis of the heartbeat sounds. Biomedical Soft Computing and Human sciences. 2008;13(1):85–90.
- Debbal SM, Bereksi-Reguig F. The effectiveness of the wavelet transforms method in the heart sounds analysis. Journal of Medical Engineering Technology (JMET). 2009;33(1):51–65.
- Cherif LH, Debbal SM. The impact of valvular pathologies on heart rate, the second heart sound split, and systolic pulmonary arterial pressure. Journal of Mechanics in Medicine and Biology. 2018;18:1.
Keywords
Cardiac sounds; Temporal extency; Frequency extency; Spectro-temporal analysis; Short-term fourier transform
Cite this article
Debbal SM. Analysis of the four heart sounds statistical study and spectro- temporal characteristics. Clin Case Rep J. 2020;1(4):1–13.
Copyright
© 2020 Debbal Sidi Mohammed El Amine, This is an open access article distributed under the terms of the Creative Commons Attribution 4.0 International License (CC BY-4.0).